Behind every on-time furnace heat and every steady production shift is a chain held together by people whose names rarely make the meeting notes : dock workers, drivers, and dispatchers. They turn uncertainty into flow. This is their world – told with the numbers that actually move costs, schedules, and trust.
1. Why they matter ( in numbers )
- 70–85% of end-to-end variability in an average raw-material movement is people-and-coordination driven ( not price ).
- A single 8-hour slip on one import lot can ripple into rake rescheduling, berth misses, and boiler de-rating the next day.
- Improve three human KPI – OTIF, first-response time, and grade/quantity variance handling and you typically see 5–12% lower delivered cost per tonne within one quarter (illustrative range, depends on lane mix ).
Quick glossary
OTIF = On-Time In-Full
Dwell = Time cargo waits between process steps
Variance = Deviation from contracted spec or quantity
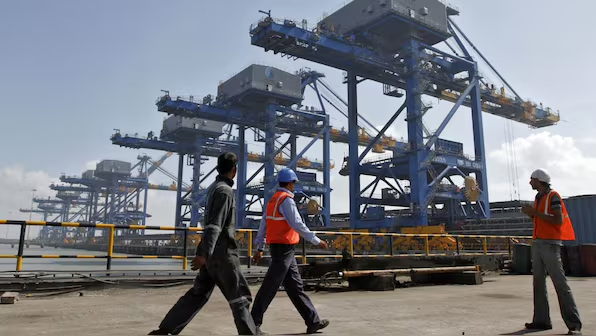
2. A day on the quay – Dock workers
Who they are : crane operators, lashers, tally clerks, signalers, equipment mechanics, yard planners.
What good looks like ( benchmarks ) :
- STS crane productivity : ~22–30 moves/hour (TEU-equivalent), over an 8-hour shift that’s ~180–240 moves per crane.
- Bulk unloaders : 800–2,000 tonnes/hour depending on gear and berth, rain and swell reduce rates.
- Yard re-handle ratio : Aim ≤1.3 (each box/stack handled no more than once extra).
Hidden skillset :
- Reading swell, wind, and rain windows, sequencing gangs to avoid rehandles, spotting “sticky cargo” early and flipping to contingency equipment.
Micro-wins they create :
- +1 move/hour on an STS crane = +8 moves/shift, shaving ~15–25 minutes off a typical call.
- +10% faster bulk discharge across a 50,000 t parcel = ~4–6 hours saved, which often means skipping a tide and saving a day of demurrage.
Cost lens: Vessel demurrage can run ₹17–₹42 lakh/day (illustrative, depends on ship size/contract). One “saved day” at berth = budget made.
3. The long haul – Drivers
Who they are : company drivers, fleet-owner partners, dedicated lane specialists.
What good looks like ( benchmarks ) :
- Daily run-length (intercity) : 400–600 km/day including breaks and city entries.
- Average effective speed : 35–50 km/h ( terrain, tolls, check-posts, city congestion ).
- Fuel economy, loaded multi-axle (35–40 t GVW) : ~3.0–4.0 km/l diesel, tyre pressure and idling can swing this by 10–15%.
Hidden skillset :
- Choosing the right time-window to hit port gates, reading “soft closures”, and negotiating slots without burning detention.
Micro-wins they create :
- Cutting idle time by 30 minutes/day saves ~1–1.5 litres diesel; at ₹90/l, that’s ₹90–135/day per truck → ₹33–49k/year for one vehicle.
- Slashing detention beyond free time by 1 hour on both pickup and drop often pays for a driver incentive and improves OTIF.
Cost lens : Truck detention typically starts after 2–4 free hours and escalates hourly. Two hours avoided at both ends = fewer disputes and faster cash cycles.
4. The control tower – Dispatchers
Who they are : yard planners, rail coordinators, port liaisons, customer service, and the person you call at 2 a.m.
What good looks like ( benchmarks ) :
- First Response Time (FRT) : < 30 minutes to acknowledge, < 2–4 hours to action a plan.
- Empty-km ratio : ≤ 20% (intercity), ≤ 10% (regional repeat lanes).
- Slot utilisation (port/plant gates) : ≥ 90% of booked slots actually used.
- Plan adherence : ≥ 85% of movements follow the day plan; exceptions visibly re-slotted.
Hidden skillset :
- Turning chaos into sequence—lining up cranes → yard tractors → gate slots → rakes so the next baton is already in hand.
Micro-wins they create :
- 5% higher slot utilisation at a congested gate = dozens of minutes shaved per truck, multiplied by fleet size.
- Dynamic blending of lots to meet spec during rain avoids grade penalties and rework.
5. The math of delay ( so you can argue for investment )
A) Plant stockout risk
- The plant burns 2,000 t/day → 83.3 t/hour.
- An 8-hour deliverability gap = ~667 t not on the ground.
- If contribution margin = ₹1,000/t, that’s an opportunity loss of ₹6.67 lakh for that window ( not counting restart penalties ).
B) Rail & port alignment
- Miss a laycan → vessel waits 1 day → ₹17–₹42 lakh demurrage ( illustrative range ).
- Catch the window → same saving. This is why dock worker productivity + dispatcher coordination matter more than a ₹20–30/t price gap.
C) Driver churn vs. incentives
- Replacing one experienced driver can cost 1–2 months of salary equivalent in productivity loss and recruiting time.
- A ₹1,000/trip incentive tied to no-detentions + clean ePOD often pays itself in fuel saved + fewer claims.
6. Safety and well-being ( the compounding effect )
- Top three incident vectors : slips/trips in rain at quays, coupling/decoupling injuries, night-time yard movements.
- Simple controls that work : red-zone cones around live lifts, “three points of contact” rule on equipment, reflective PPE after 6 p.m., and no mobile phones on the apron.
- Leading indicators to track : near misses per 1,000 hours, safety observations closed within 7 days, fatigue flags ( night shifts >2 in a row ).
- Reducing LTIs ( lost-time injuries ) lowers hidden costs—fewer stoppages, fewer insurance headaches, and better morale → better throughput.
7. Technology that helps them ( when it’s human-first )
- OCR gates & RFID : shave 2–5 minutes per truck on average; eliminates keying errors.
- Geofenced milestones : automatic arrive/exit pings → cleaner detention clocks and faster billing.
- Yard-management apps : real-time slot swaps raise utilisation by 3–7% in busy periods.
- ePOD + photo evidence : fewer claim disputes; Claim TAT (turnaround time) can fall from 10+ to ≤ 5 business days with good proofing.
- BUT : Tools must be lightweight. If the app steals a driver’s time, it never gets the data you wanted.
8. What to recognise ( and reward )
- Dock workers : “Moves per crane-hour,” rehandles avoided, safe-lifts streaks.
- Drivers : “Zero detention,” no-idle score, perfect ePODs, tyre and fuel discipline.
- Dispatchers : FRT under target, slot utilisation, exception recovery time, forecast accuracy.
Simple program : micro-bonuses per shift for hitting 2–3 metrics, plus a monthly spotlight. Costs less than churn—returns more than slogans.
9. Dashboards you can adopt next week
A) Operations Pulse ( daily )
- OTIF % (yesterday / 7-day)
- Port dwell (hrs), Gate-to-gate (hrs)
- Crane moves/hour, Discharge rate (t/hr)
- Truck detention (avg mins), Empty-km %
- Claims opened/closed, FRT (mins)
B) Rain Mode ( monsoon )
- ARB vs. ADB variance (GCV/ash/moisture)
- Covered storage % / “open yard dwell” (hrs)
- Weather windows used/missed
- Moisture penalties avoided (₹)
C) People & Safety
- Near-miss rate, LTI-free days
- Training refresh % ( last 90 days )
- Fatigue flags closed
10. Field checklists (laminate and keep in the cab, cab-in, and cabin)
Dock-side ( shift start ) :
- Wind/swell check
- Gear log
- Lash plan
- Yard stacks pre-assigned
- Rehandle target ≤1.3
Driver ( pre-trip ) :
- Tyre pressure
- Brake check
- Route+slot window
- Detention timer ready
- Fuel/AdBlue levels
Dispatcher ( hourly ) :
- Slots vs. live queue
- Exception board < 5 open flags
- Geofence pings matched
- Rake alignment
- First-response < 30 min
11. Frequently asked ( and actually useful ) questions
Q: What’s a realistic OTIF target?
A: ≥95% is a credible floor in bulk supply chains. World-class lanes hit 97–98% for weeks when the weather is kind and buffers are right.
Q: Where do we get the first 10% fuel improvement?
A: Tyres and idling. Keep pressures optimal; audit idle time. Add cruise discipline where terrain allows.
Q: How do we cut detention without fighting at gates?
A: Book slots like airline seats; publish no-show rules; swap slots via a shared dashboard. Incentivise early shows with small credits; penalise no-shows gently but consistently.
Q: Rain kills our bulk discharge. What now?
A: Shorten open-yard dwell, prioritise covered yards, pre-position moisture-resistant cargo, and blend to contract basis (ARB). Track “wet hours” and re-plan the next tide.
There are no “unskilled” roles in a supply chain that feeds blast furnaces, power boilers, or cement kilns. Dock workers buy you tide and time. Drivers turn kilometres into certainty. Dispatchers turn chaos into sequence. If you want lower delivered cost per tonne, start by treating these roles as profit centres – because in practice, they already are.
Anupam Fuels partners with teams exactly like these every day – aligning specs, routes, gates, and rakes so your plant never runs on hope. If you’d like a people-first performance plan for your lanes (with the dashboards above), we’re ready to help.